

the motivation
In 2019, the Conservative party won its largest parliamentary majority in a generation. How? Understanding the factors that drove this victory (and, by extension, the opposition Labour party's biggest loss in nearly a century) could help to influence party policy, as well as strategies for the coming parliament and beyond.
the approach
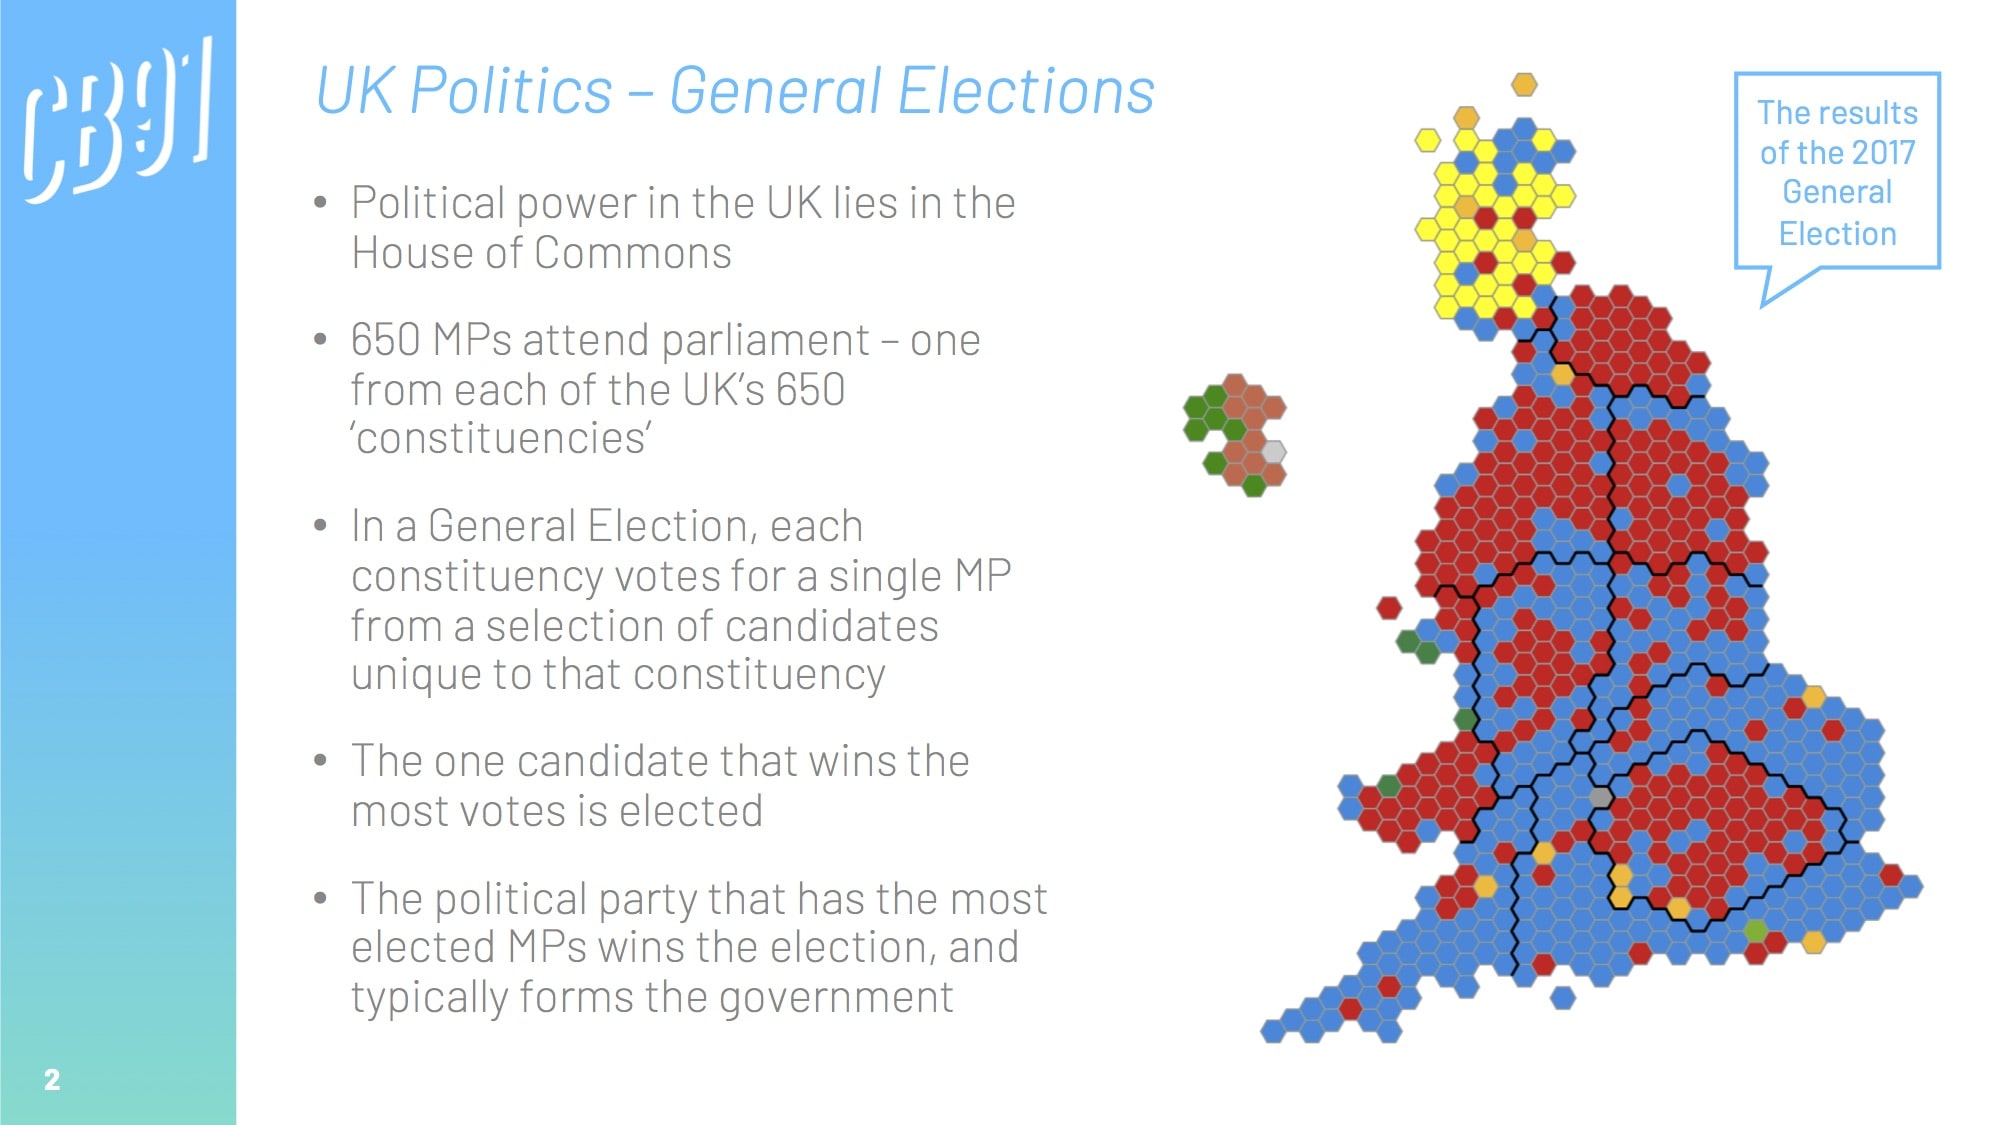
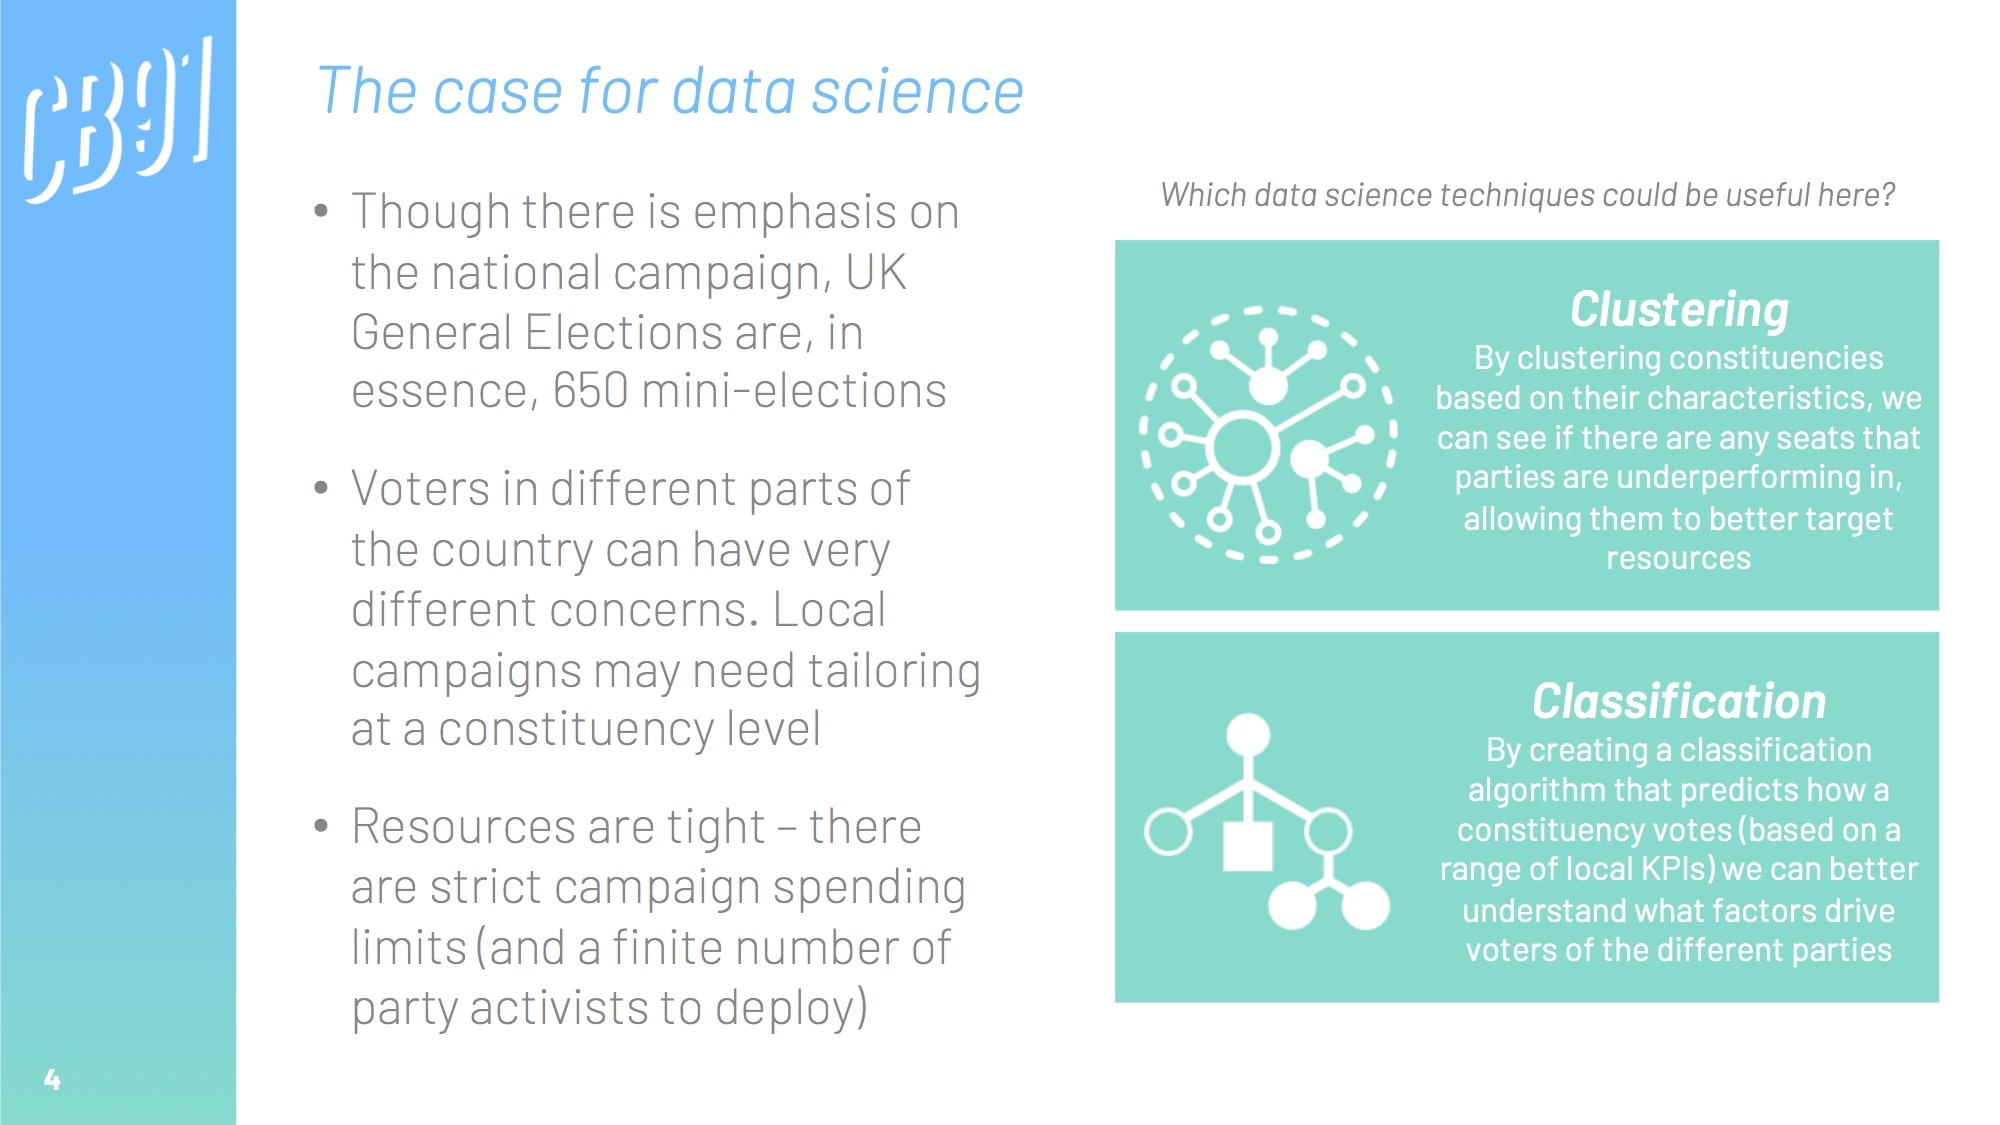
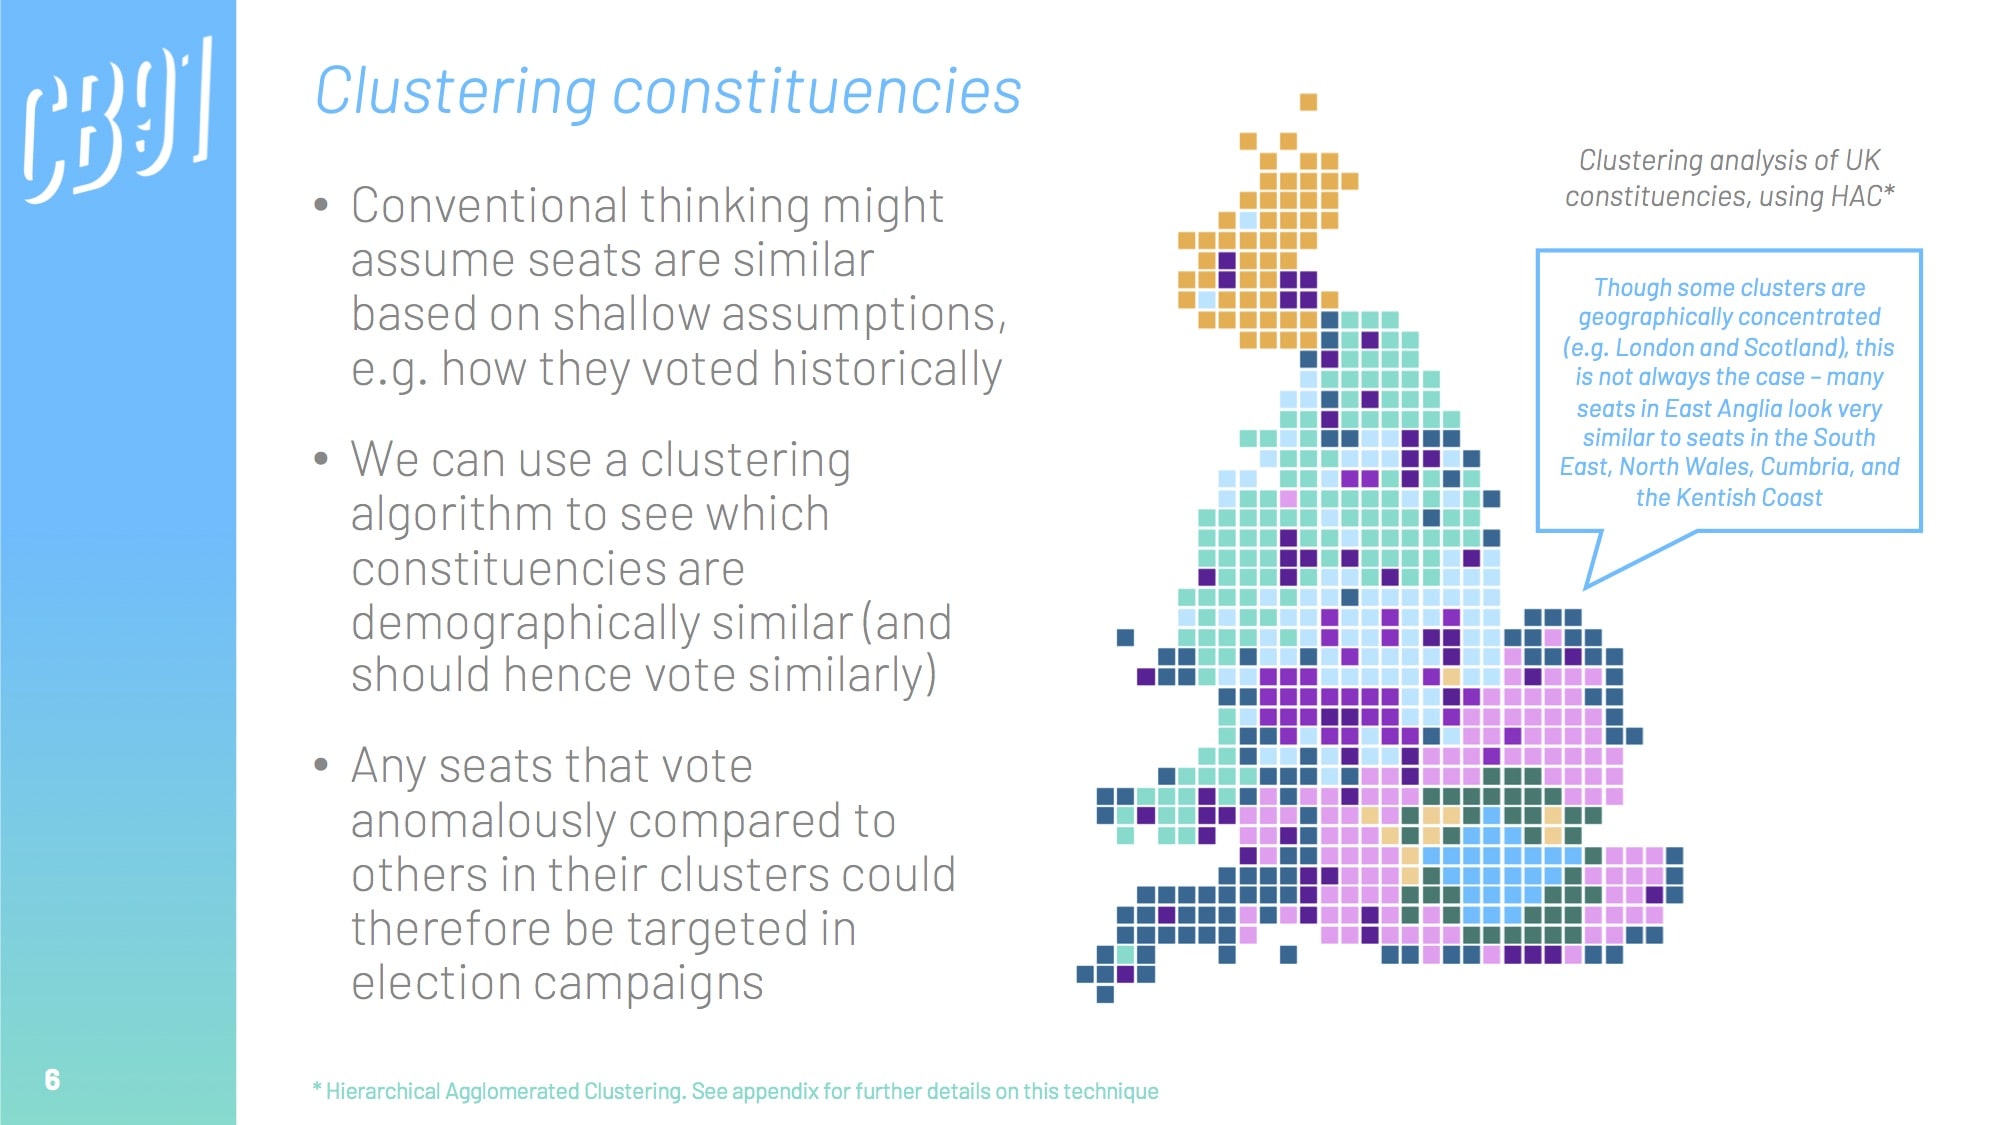
Though there are always overarching national factors that influence how people vote, general elections are, in essence, 650 local mini-elections (one for each of the UK's constituencies).
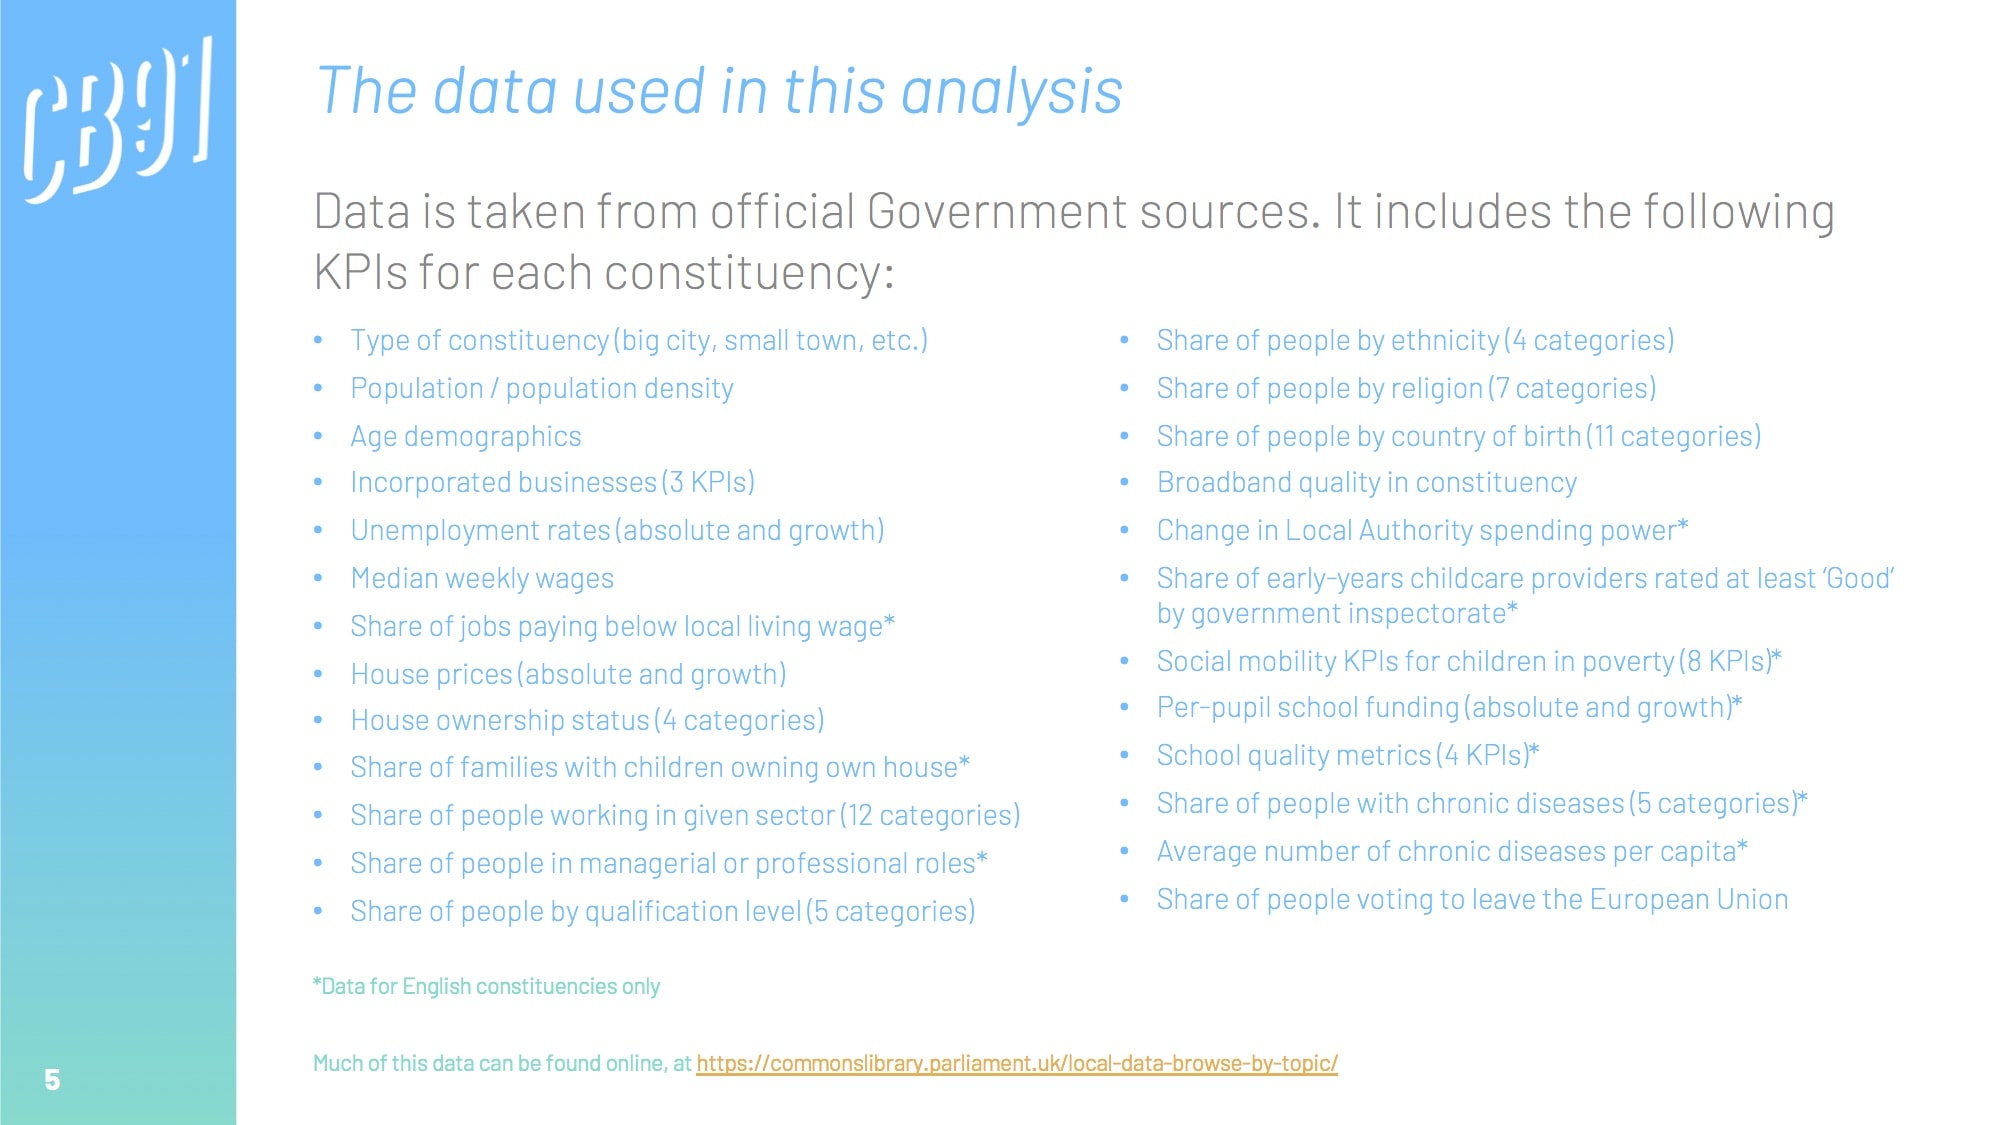
Happily, a lot of official data is available at a constituency level through government websites. We can pull this together to create a grand table of constituency-by-constituency KPIs across a range of metrics; from house prices, weekly wages, and population density, to educational attainment, ethnicity, and even broadband quality.
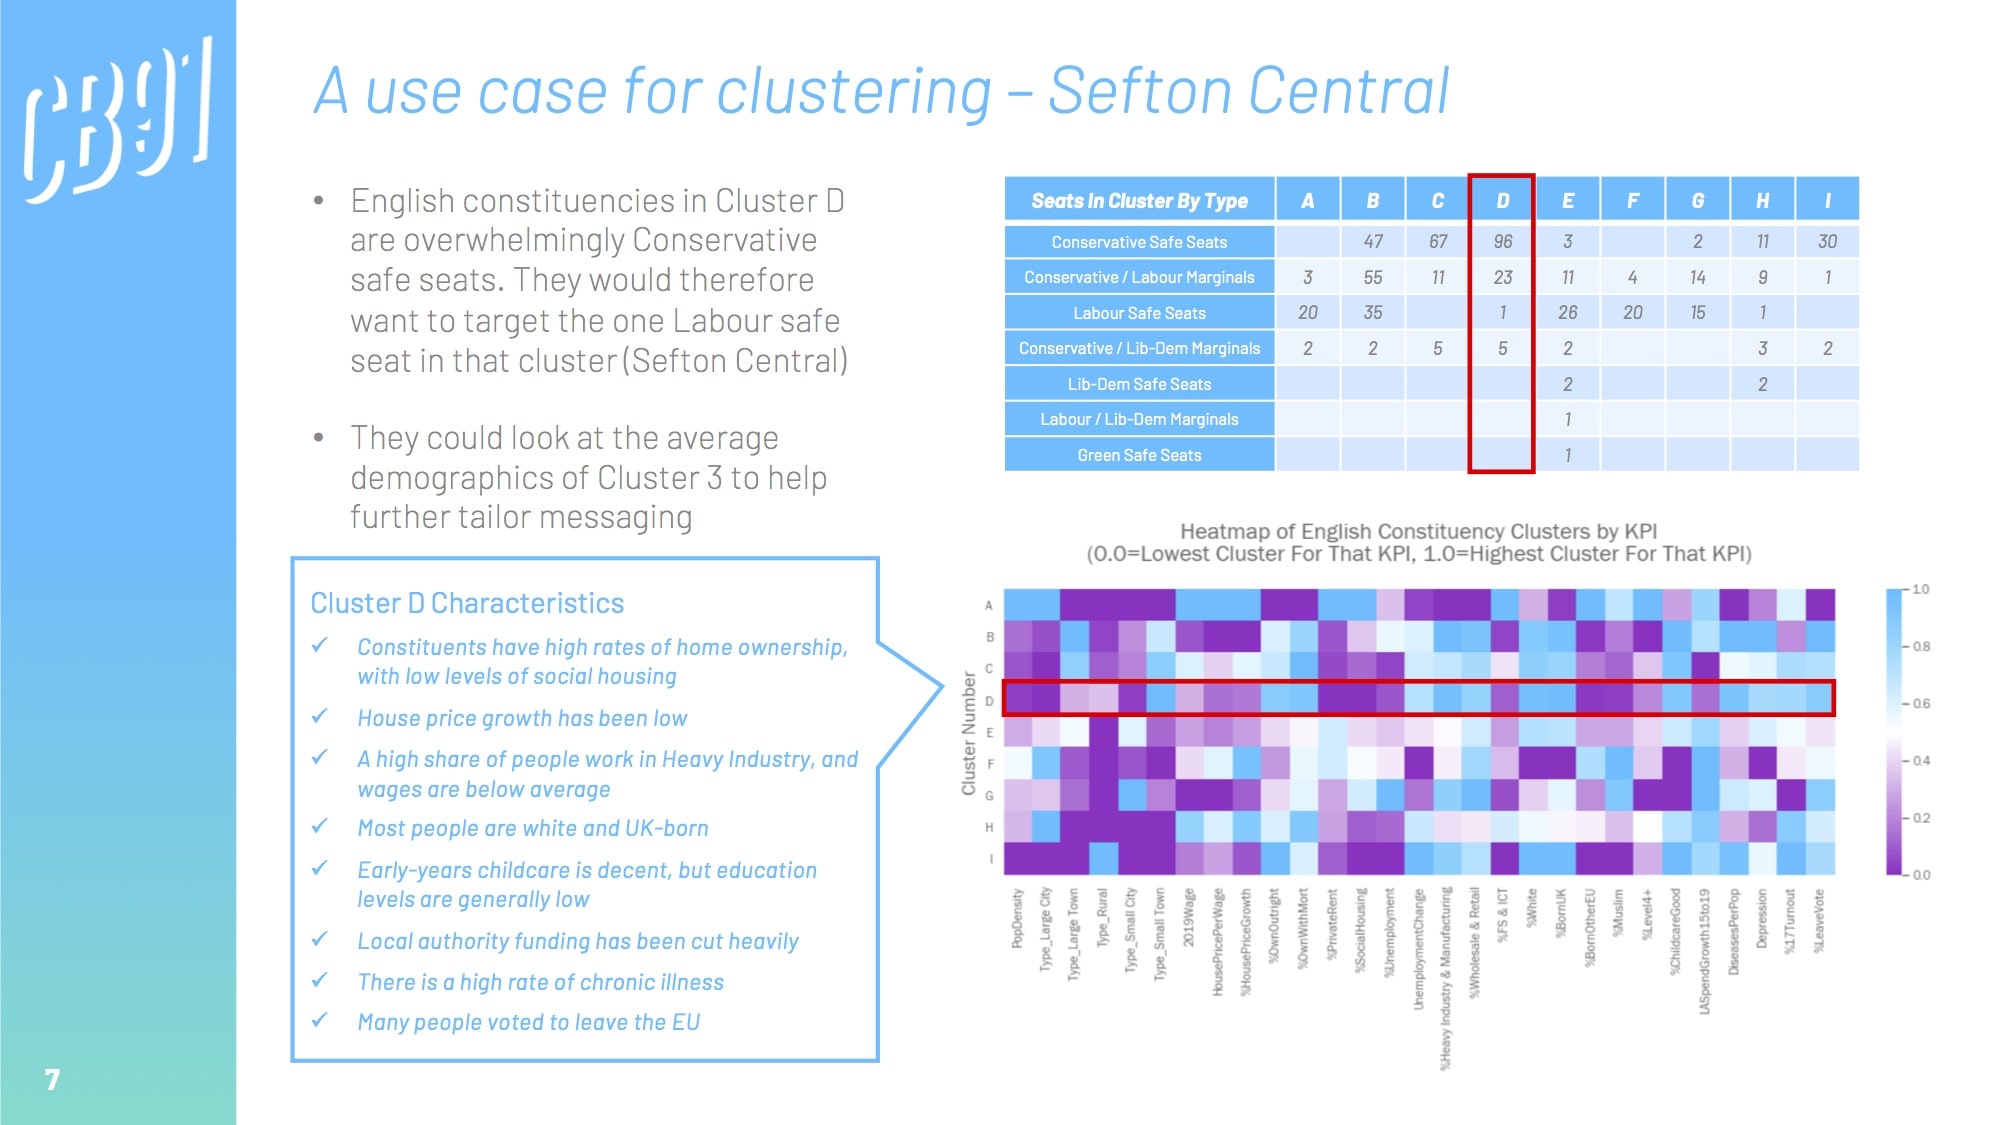
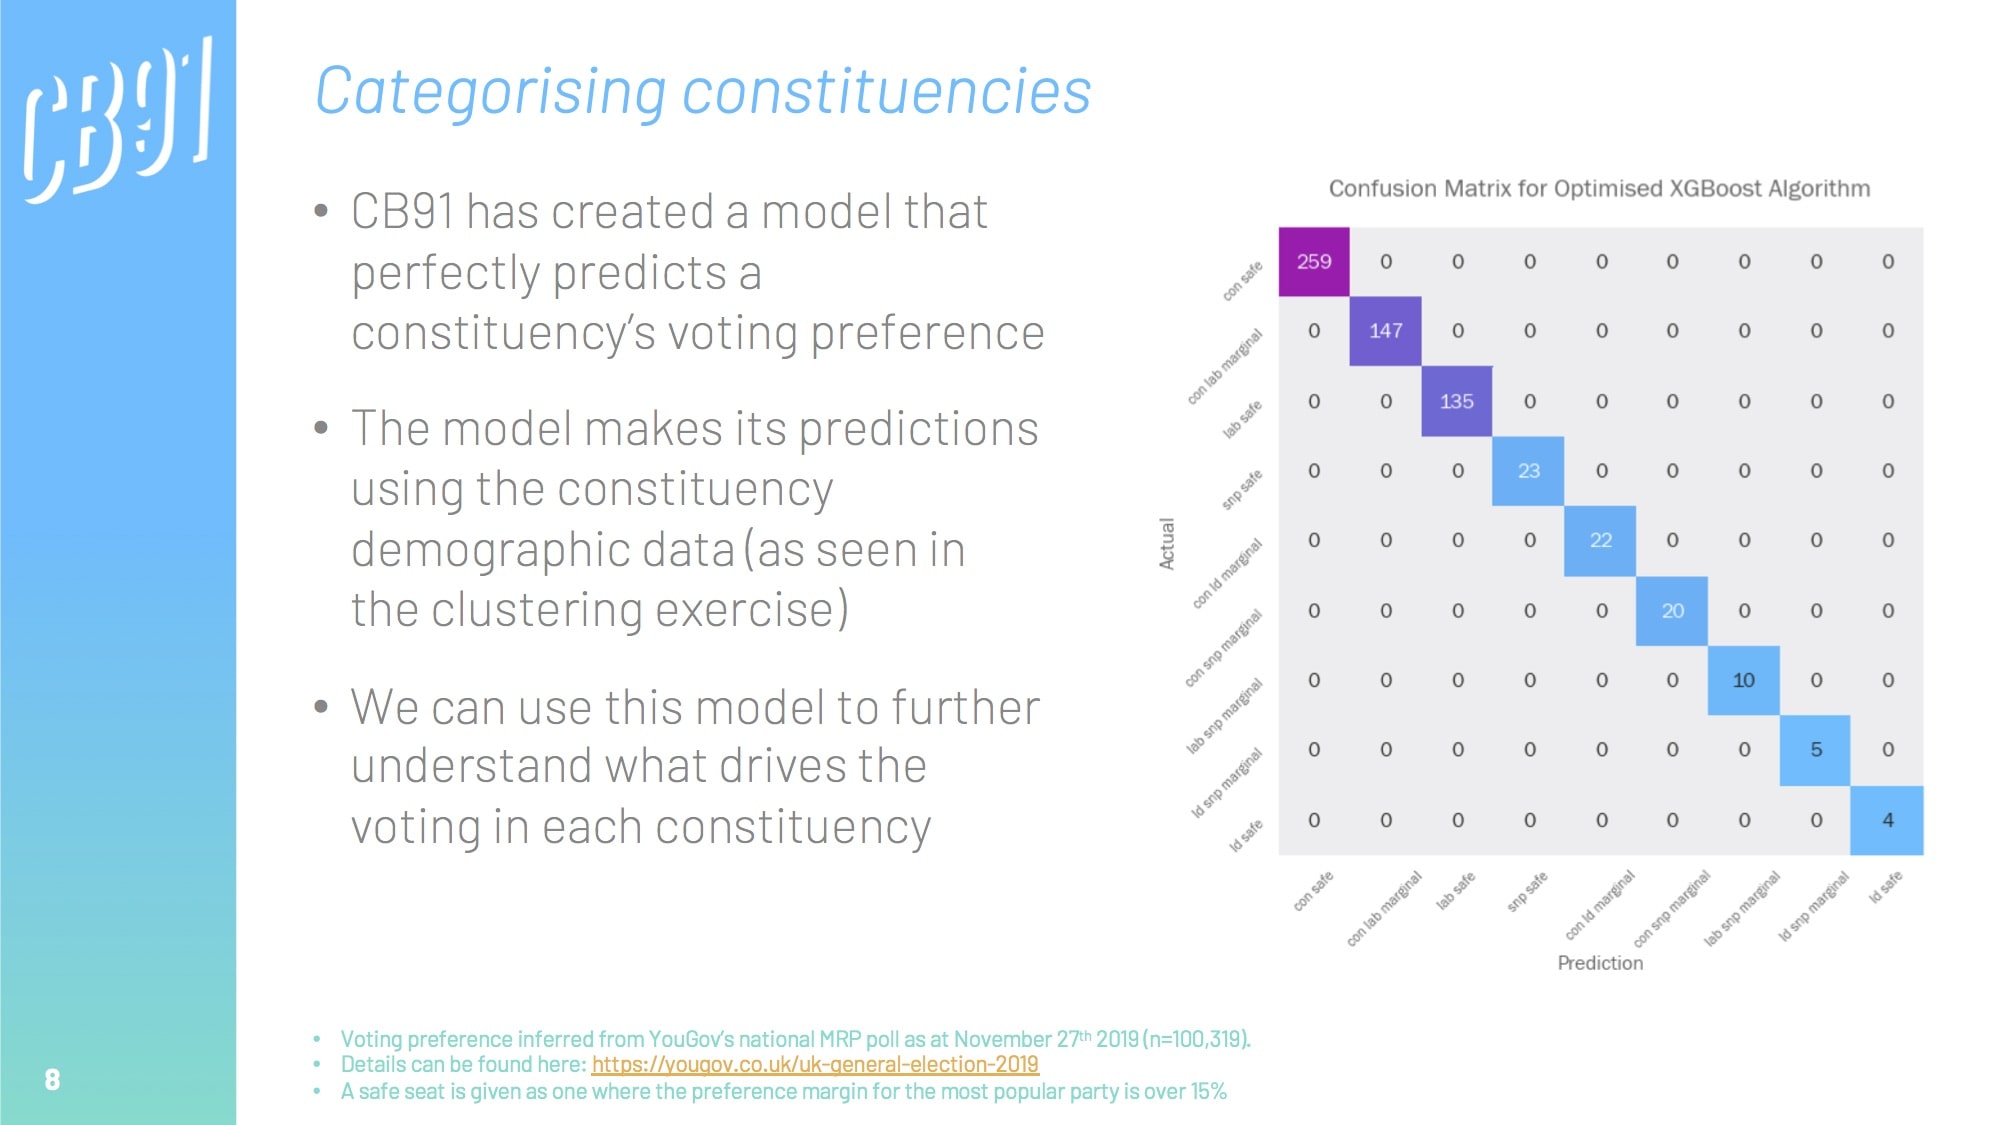
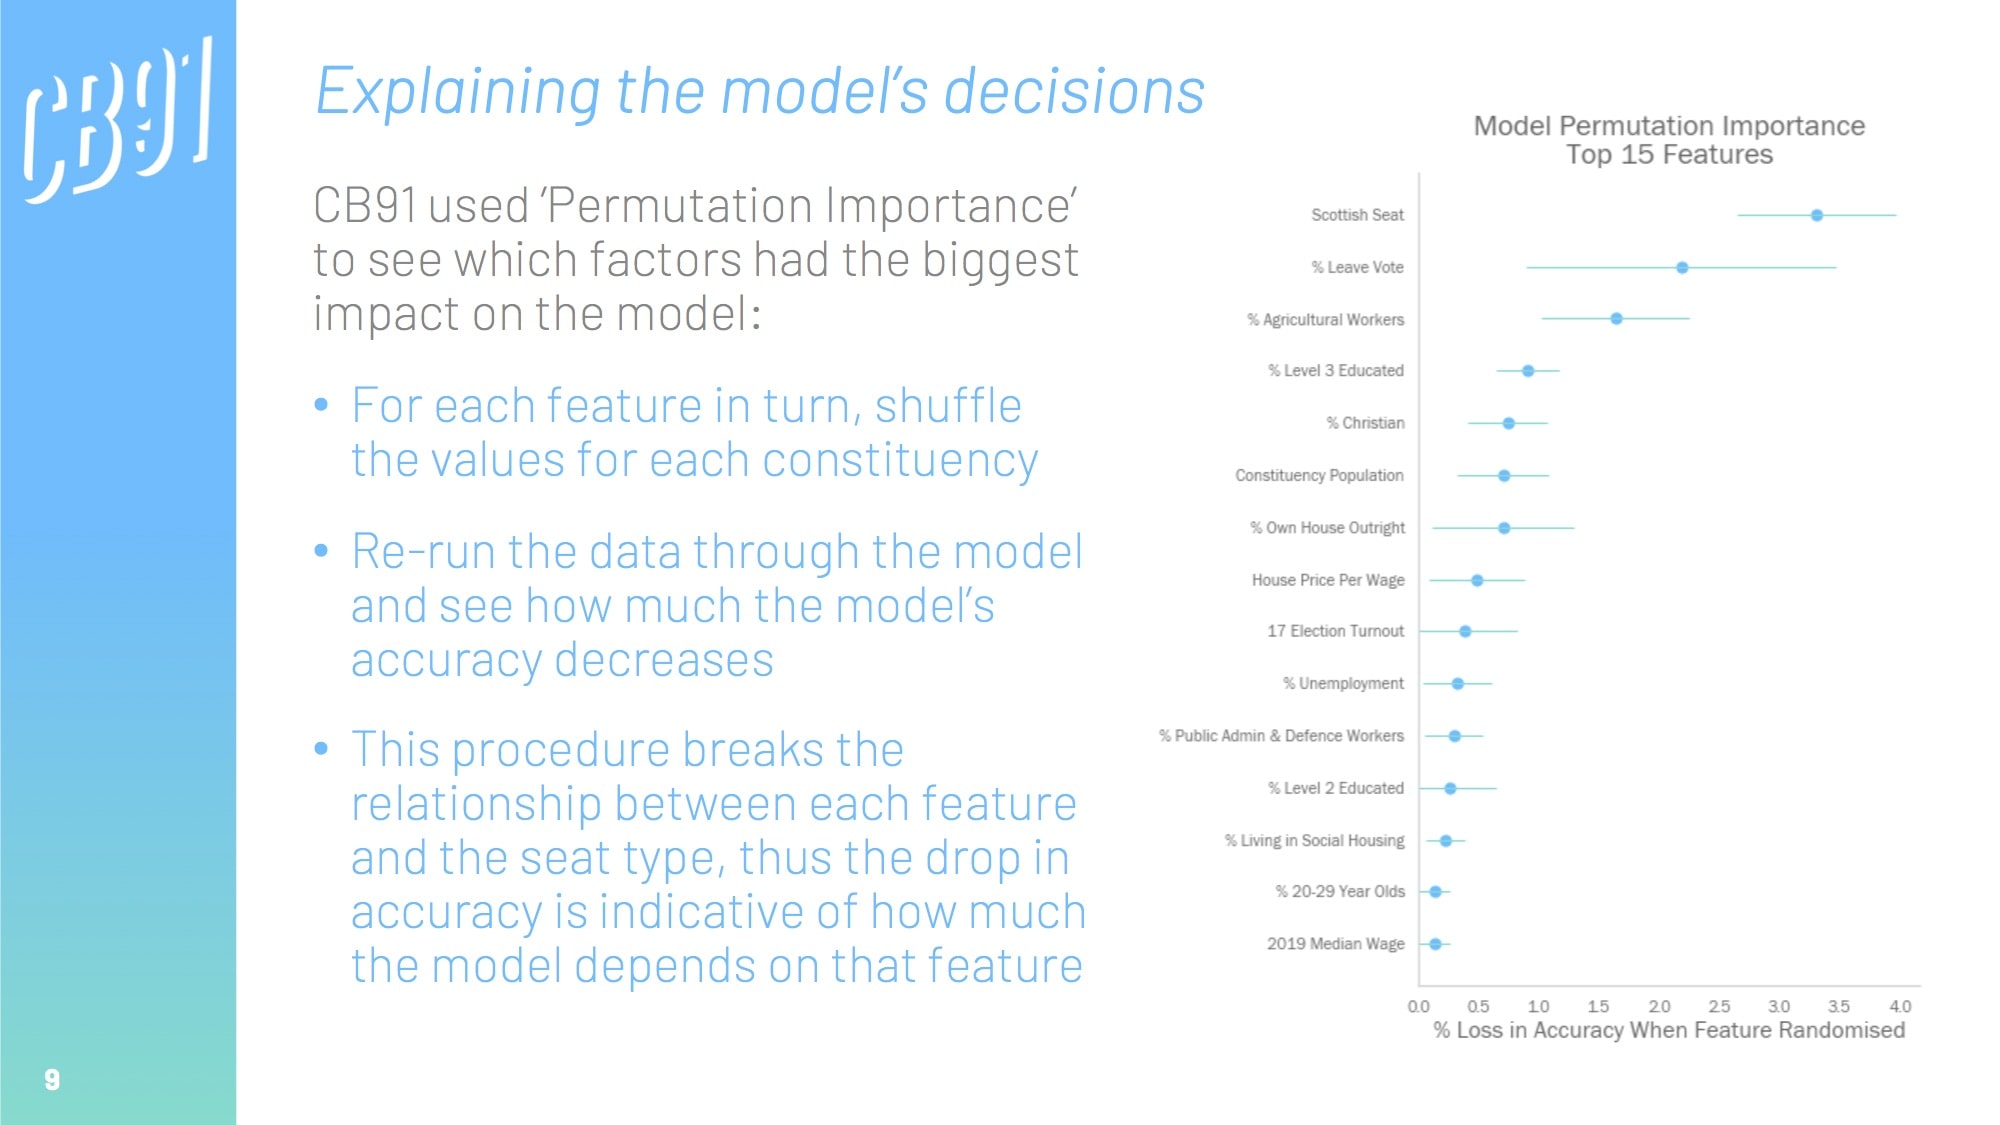
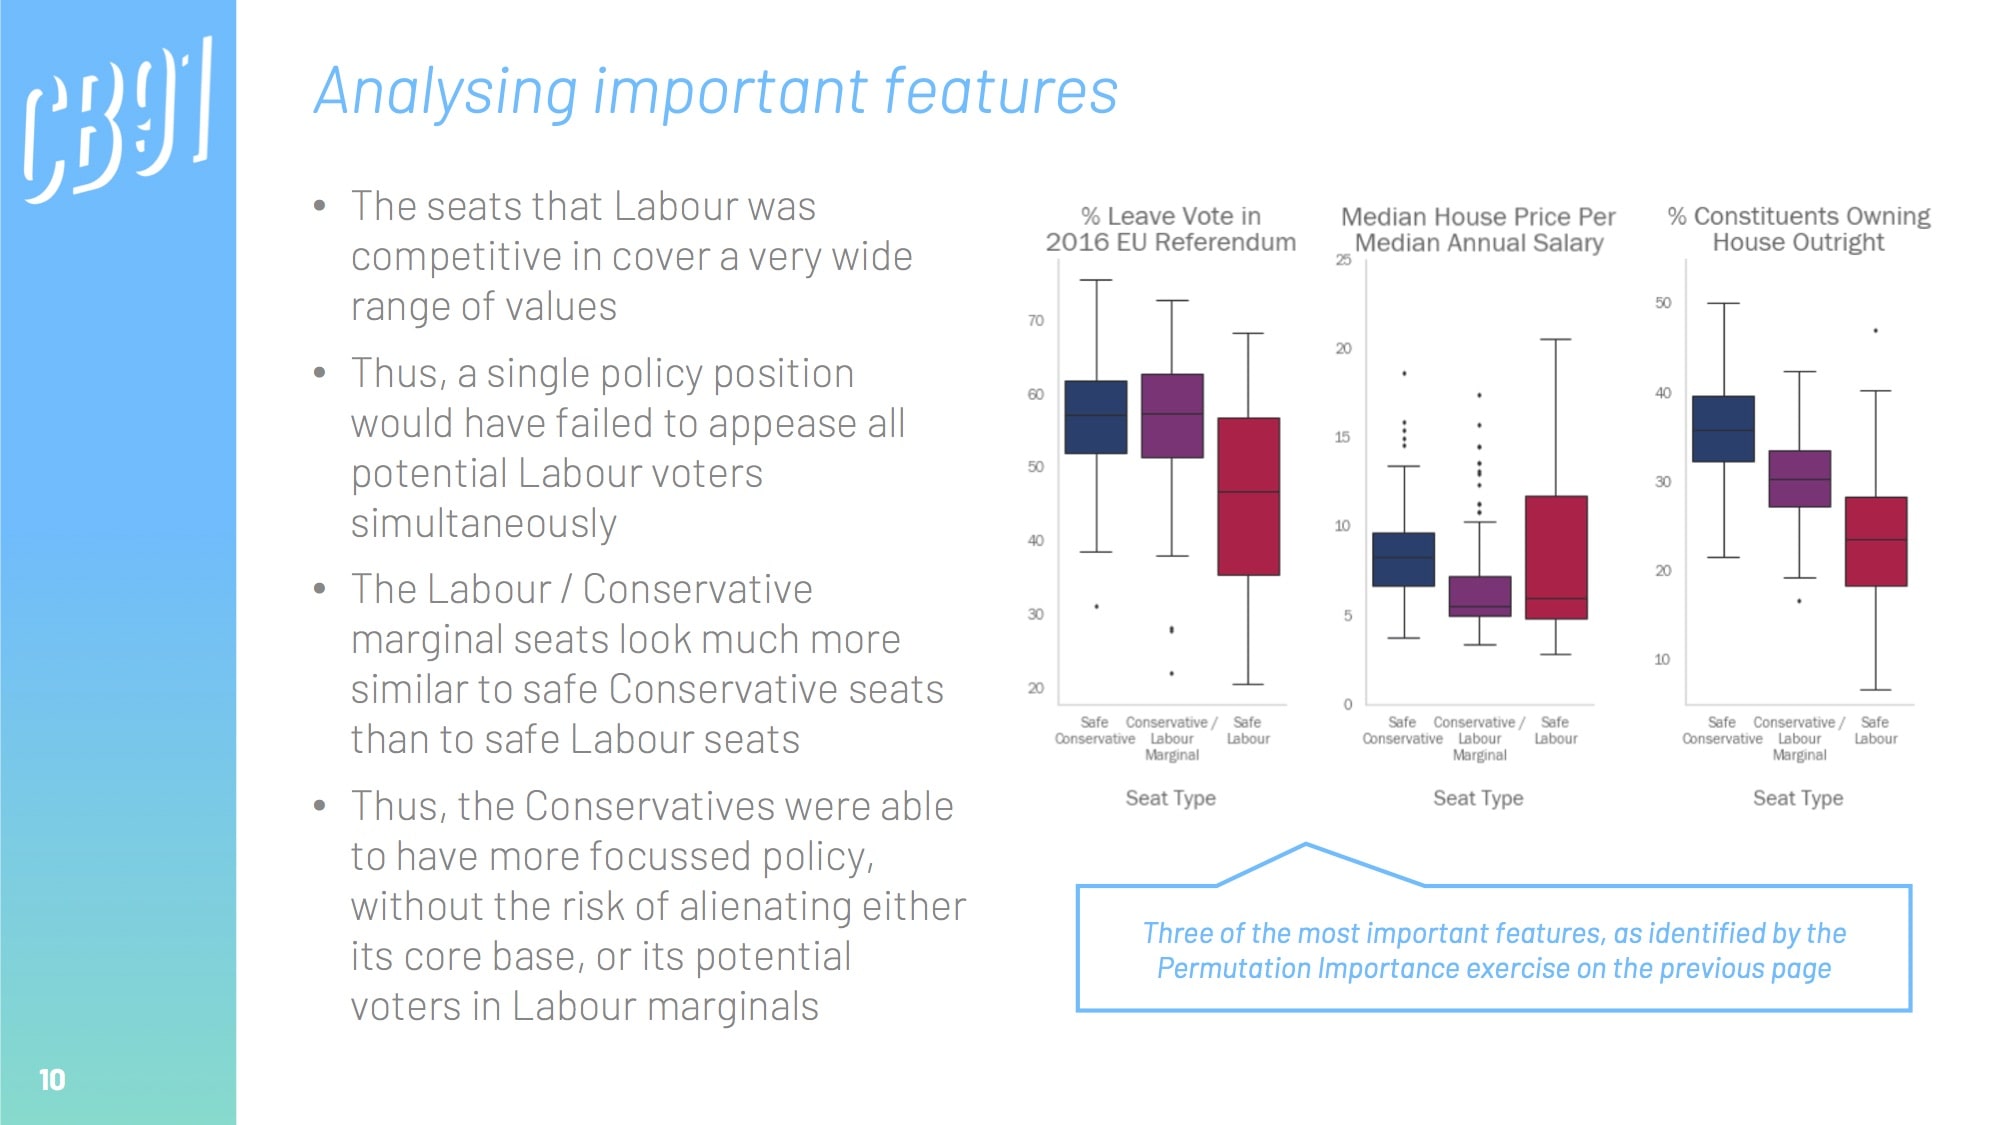
We can create a model that uses this demographic data to predict which party is likely to win in each constituency. Once we have developed an accurate model, we can analyse it to see what the most important drivers were, thus inferring the biggest electoral factors.
the techniques
Analysis conducted using Python libraries and APIs:
- Pandas for data munging
- XGBoost, and Scikit-learn Random Forest / Decision Tree classifiers for building classification engines
- Scikit-learn GridSearchCV for hyperparameter tuning
- eli5 for Permutation Importance
- Matplotlib and Plotly for data visualisation
the GitHub repo
View the readme on the project's GitHub repo for a full breakdown of the project.
the findings
This presentation was created to be presented to a non-technical audience in under 10 minutes.

the blog
"On September 2nd, Boris Johnson, the UK’s Prime Minister, stood on the steps of 10 Downing Street and announced that he didn’t want a general election. Anyone with an ounce of political nous knew what was coming next..."
 Follow Callum Ballard on Towards Data Science